TradingView indicator · invite-only access
Fractal Model Pro draws the four-candle model on your chart.
It marks the swept level, the Candle 2 reclaim, the paired-timeframe close that confirms it, the projections, and the price that invalidates the read. One confirmation/model pair at a time, in the same labels every session.
$49/month or$499/year. Access is granted to your TradingView username within 24 hours after checkout.Pricing
What FMP draws
Four things, in the indicator's own labels.
Everything on the chart is one of these. The Model Monitor repeats the state in text: MAIN, LIVE, Bias, CTX, and SMT.
- C1 · C2 · C3 · C4The four-candle model
- Candle 2 must sweep the Candle 1 extreme and close back through it at a qualified point of interest. One confirmed reversal owns the map through Candle 4.
- CISDConfirmation by body close
- The open of the last opposing run. Dashed while pending, solid after the first paired-timeframe body close through it.
- -1 · -2 · -2.5 · liq ✓Projections and liquidity
- Standard-deviation targets measured from the manipulation leg, and the unswept pools above or below, ticked as price takes them.
- ✗Invalidation
- If price trades back through the sweep extreme, the map is removed. A failed read is never redrawn as a winner.
On a real chart
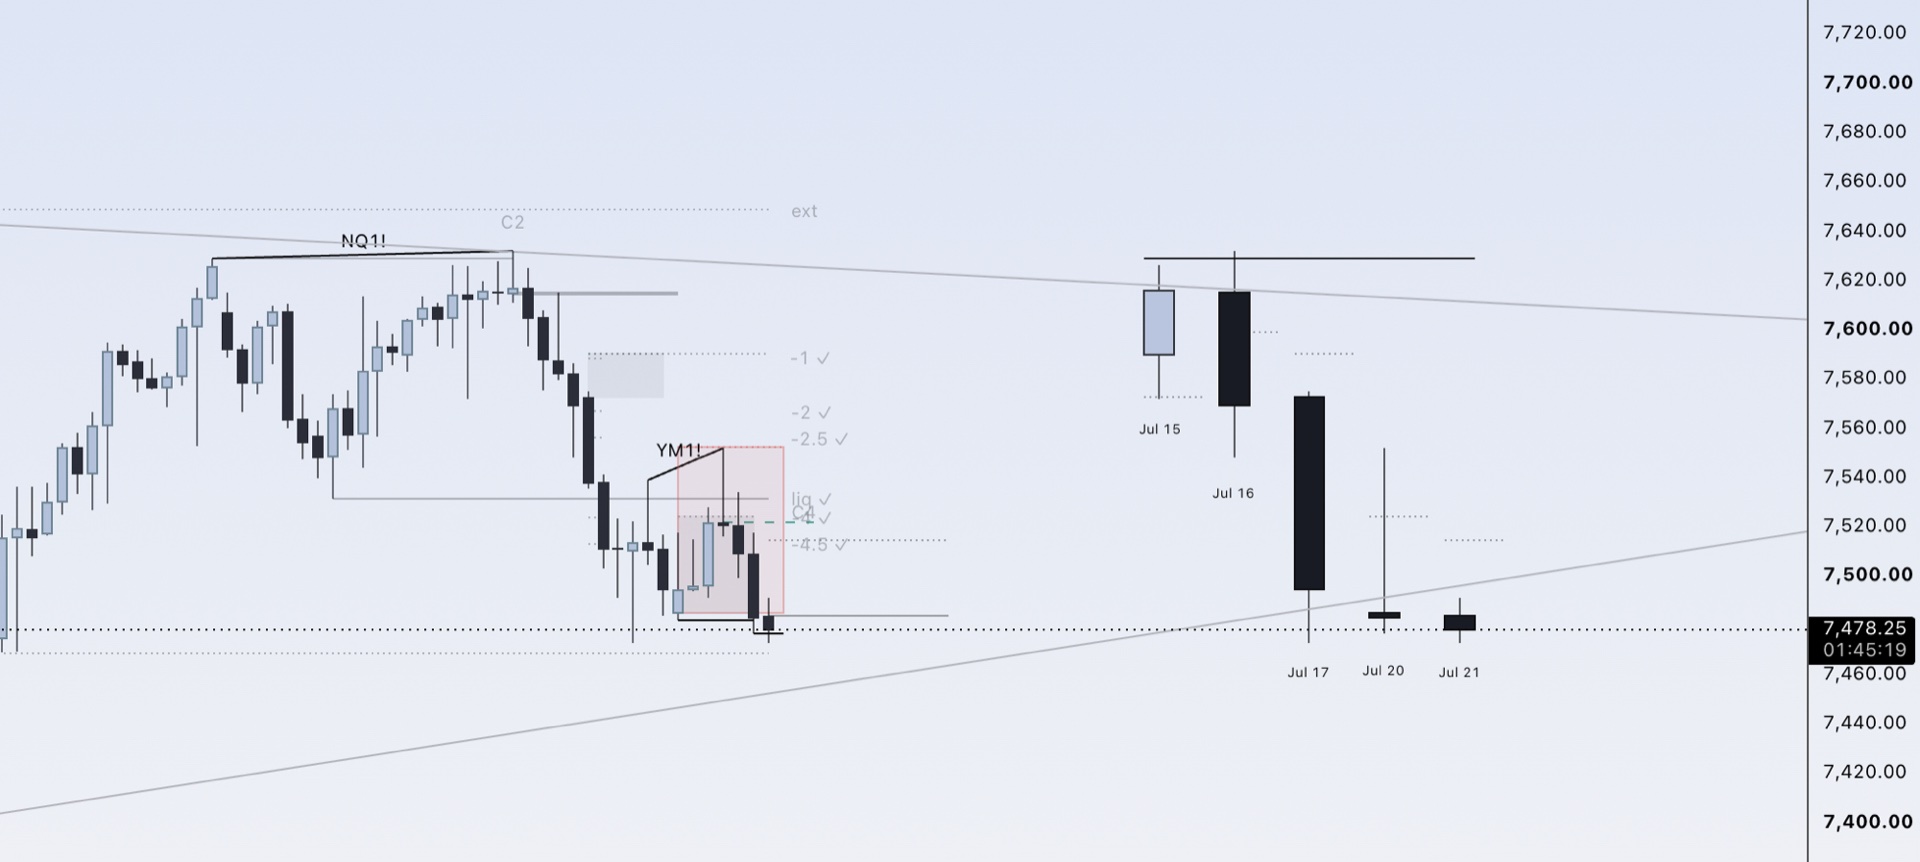
ES, 1-hour chart, daily model.
After a delivered Candle 3 the continuation zone is drawn from the completed range and the new period open, so it exists before the retrace. SMT tags compare ES with NQ and YM at the same touch. The ladder shows which projections FMP had marked delivered.
Historical capture from July 2026. An example of the overlay, not a signal or a performance record.
Timeframe pairs
One confirmation chart, one model candle.
FMP maps the chart you are on to the model candle it confirms: 15m confirms 4H, 1H confirms 1D. Broader models stay on their own charts and nothing propagates down. An unsupported interval pauses the model and says why.
How the chain worksBefore you pay
Learn the model from the free lessons first.
Six lessons cover the sweep, the four-candle sequence, Candle 2 closure, CISD, the timeframe chain, and delivery. Read them, then decide whether the software belongs on your chart.
Educational software. FMP places no trades, gives no individual advice, and makes no outcome claims.